Race Report – National 24 Hour Challenge, Middleville, Michigan, 15-16. June 2019

By , 17 June 2019 14:20

Race Report
National 24 Hour Challenge, Middleville, Michigan, 15-16. June 2019
[Strava Link]

So I went to this race in Michigan that I believe is the closest 24 hour road cycling race for me. It’s a bit of a drive to get there (1,000km). I had done it before last yeast and really liked it – it’s about 250 riders each year; not too big, not too small. It’s a really neat concept, having three different loops on which riders can accumulate miles: first riders complete the 194km loop #1 once, then then move on to the 36km loop #2, which they ride, depending on their speed between 1 and 5 times and then between 7 and 8pm they move to the 12.5km loop #3 which they do as often as they want until the event is over at 8am. Only completed loops count towards mileage.

Near the start line. To acknowledge the half dozen or so Canadian riders, they have our flag up and play O Canada before the race. Lots of people stay in tents at the site the night before the race, though I picked the school gym instead.

Anyways, last year, I went a bit too hard on loop #1, going with the first 3 person break and paying the price later. I also had a whopping 6 flats (turns out my rim tape had a rough spot) which cost me a lot of time. I managed to accumulate 415.5miles/668.7 km last year, which earned my an age group bronze and a 19th out of 230 overall placement. So my plan for this year was to not repeat the mistakes of last year (going with a small breakaway group, having 6 flats) and beating my previous numbers, with a stretch goal of beating 700km. Essentially, for me the race went down in three phases, which I call: Loop #1, Train Engine, Dark Place.

Phase 1: Loop #1. The race started 18 mins late due to a traffic accident on the route (not related to the race) and then we were subject to a detour around the site of the accident. I stayed up close to the front, to be able to see any break outs and to judge, by their size, whether I wanted to join them. The “pack” – perhaps 20-25 riders up front – stayed together pretty well, at some point toward the end of the first hour I did a little solo break for 10 minutes or so, to get the need to be in front out of my system, which was a good idea in hindsight because during that time there was a crash of a few riders in a sharp left turn. Anyhow, once that was out of my system, I tried to find a good spot not too far to the front and not too far back, which was hard because there were a few people up front who were really going super hard and then a number of others that were better matched to what I wanted to do but were not very consistent with sticking with the group, so it felt hard to find a consistent pace and to establish a consistent pace line. For a while it worked though, at the best point we had a 11 person pace line going with only 15 seconds pulls each, but then we ended up dropping people and the group shrank to 6, then 5, then 4. By that time, I think there was another 2 or 3 person lead group ahead of us. It was challenging to stay with that group, especially since the person who’s turn it was to pull right after me was going way too strong, so it always was a struggle to hold on right after my own pull. I also felt that I was going too hard and that the scars from my minor surgery just 8 weeks ago would come undone. But on the other hand, riding with a group is just so much faster, so I decided to stick with them until the end of the first loop for sure. So I did that, and we completed the 194km loop in 5:39:14 at an average speed of 34.3kph. For me, the intensity was 86% of FTP, which is borderline fine for a 194km ride but obviously not sustainable for a 24 hours race. Loop #1 is also the hilliest of the loops with a 1015m total elevation differential.

Phase 2: Train Engine. So after restocking food and drink at the checkpoint at the end of loop #1, the same group got back together to ride loop #2 together. The same problem persisted – it was just a bit too hard to properly work for me. But riding with a group is just so much efficient than riding by yourself, so I went with them. However, the two bagels that I had eaten at the checkpoint at the end of loop #1 wanted to be digested so I felt a lot of the energy being redirected from the legs to the stomach and it became harder and harder to keep up (and feeling more and more vomitty). So somewhat reluctantly, I let them go. My estimation was that, including these three, there were about 6 or 7 people ahead of me at that point. The rest of that 36km loop was spent feeling a bit crappy, worried about my surgery scars, and finding my legs and my pace. Once I found it though, the next time going around that loop (and the next, and the next), it felt amazing and I just spend most of my time low in the aerobars, putting out consistent effort and flying along. Nice. I felt like a train engine, strongly chugging along at a consistent pace and unstoppable. Weather is also ok, 16°C perhaps a smidge lower than I would have picked if somebody would have asked my opinion, especially in a sleeveless tri top, but completely and thickly overcast sky meant that I didn’t have to worry about sunscreen. During the 3rd time doing the loop, it started to rain (sprinkle, really), which is not ideal in the cold. I ended up doing loop #2 4 times, in averaging 31.4 kph, with a 73% intensity. After the fourth time, I still would have had enough time for one more go-around loop #2, but loop #3, the night loop, was already open by that time and since #3 is quite a bit flatter than #2, it seemed a no brainer to move to #3. In hindsight, doing #2 one more time could have given me the chance to tie with the person who ended up only 1.2miles ahead of me, both overall and in my age group. Next time. Once I started to move to the night loop, the locomotive feeling stuck with me. It’s a good feeling. The night loop is very flat, with one downhill section where you can rest in an aerotuck for half a minute and one annoying, but short, uphill section. All turns are right turns and the five turns/intersections of the loop have flood lights installed and police officers all night to stop the little traffic there is and let riders through. I got into a pretty good rhythm, doing three loops, then stopping for support (pulling into the station) to get my Gatorade bottle swapped, take an electrolyte capsule and get a bagel and/or cliff bar and an apple. The drizzle started to annoy me a bit, since I was quite cold for like half a loop after each stop. Temps had dropped to 12°C by now and I was completely drenched. Around 10pm, 14 hours into the ride, I started to get pretty clear signals from my stomach that no more solid foods, with the possible exception of bananas, would be accepted from here out. I nearly puked trying to eat a cliff bar and eating a bagel seemed way out of reach. The rain stopped around 11pm and at midnight the roads were dry enough that I felt it was worth changing into dry clothes. OMG. Dry Clothes! A whole new fabulous world of not being cold. It felt really good having my own rhythm. I passed people all the time; sometimes I happened upon somebody not much slower than me, so I checked if we could do some mutual drafting but if never worked for more than a few kms. That was fine though because being alone with your thoughts, your body and your rhythm, for hours and hours through the night, is just such an enjoyable experience.

Phase 3: Dark Place. Around 3:30am (4.5 hours before the end of the race), my support people told me that I am currently in fourth place overall, with only a sliver of margins between me and the person ahead of me, and a solid two laps between me and the person behind me. That made me spend the next little while doing a bunch of calculations in my head and reformulating my strategy for the last four hours. I knew that I can do a lap in 30 minutes with reasonable effort and as fast as 25 mins if I really put down my head and worked very hard. I still needed to allow for some time for refueling stops and checkpoints, so that 8 laps in 4 hours seemed doable but not a slam dunk, while 9 seemed pretty much out of reach. 8 more laps would also tie me with my results from last year, which is not what I wanted but with the wet and cold conditions were much more challenging this year, so there I had my excuse. I figured that if I managed to average 28kph over the first 4 laps, I could let it drop to 26kph for the next 2 and to 25kph for the last 2. Managing that, I was guaranteed my current placement, and whether or not I could increase my rank by one spot depended on how many laps the other person would pull off. Managing a 28kph average after 20+ hours in the saddle was not super easy, however, especially with probably every last carbohydrate in my body burned by now. I needed to dig pretty deep and my thighs in particular starting to hurt pretty bad, as did my lower back. I stretched the back whenever I got a chance and it got quite a bit better, though the thighs still wanted me to stop. The 2 hours between 4 and 6 were pretty dark both literally and figuratively and it took a lot to keep the effort consistent. Once the sun started to come up, the euphoria of knowing it’s over soon started to help, but turning over those cranks kept getting harder. Halfway into the second to last lap, two riders came up from behind at a decent clip, so I grabbed their wheel. Turns out they had been taken it easy overnight and now wanted to burn off the rest of their energy. Worked for me since they didn’t even want to take turns with me on the pulls. So I got in at 7:46am, which was not enough for one more lap, but had the race not started 18 mins late, I could have easily squeezed one more in (this is just me justifying how it’s ok not having beat last year’s figure)

Don’t Think – Just Ride

So results. My official mileage was 415.5miles, 668.7km, in 21:55:52 moving time, at an average of 30.3kph and an overall intensity of 74% of FTP. I didn’t manage to change the standings relative to where they were at 4am and ended up 3rd in my age group, 4th overall, with only 1.2miles behind the person in front of me. This is much better than last year, where I placed 19th overall (though still 3rd in the age group). The wet and cold conditions certainly played a role, but also I got much less training done this year compared to last due to the surgery (last year at the time of the race I had 4,200km under my belt since January, this year only 2,100). I’m very happy with the result, and cannot recommend this race enough. It’s superbly organized, has an amazing spirit on the course and off and is a great challenge and additional to any race calendar.
How Much Climate Change Mitigation Action Would Result From Efforts Comparable to Canadian Provinces’ Climate Targets?

By , 3 June 2015 15:08

Earlier today, I presented at the 2015 Annual Conference of the Environmental Studies Association of Canada, as part of Congress 2015 in Ottawa. Here are the slides of my presentation and below is a slightly edited version of the talk I had prepared. The presentation was entitled “Do Unto Others… How Much Climate Change Mitigation Action Would Result From Efforts Comparable to Canadian Provinces’ Climate Targets?”, and here you go.


What I am going to talk about today, is to look at climate mitigation targets of Canadian provinces and how much mitigation we’d get if other provinces or countries would match them. I am doing this by thinking about a province’s target not in relation to some historical base year, as we usually do, but in relation to what can be said to be that province’s F-A-I-R S-H-A-R-E of the overall global effort to address the climate crisis.

In order to do that I will first provide some brief background on the Climate Equity Reference Framework that I’ll be using. Then we’ll look into some specific (and partially surprising!) results that we get when applying an equity framework to the question of comparing provinces’ mitigation targets. Before closing, I will offer some thoughts of what we can take away from this.

2015-06-03_ESAC-Panel8-CHOLZ__Slide03

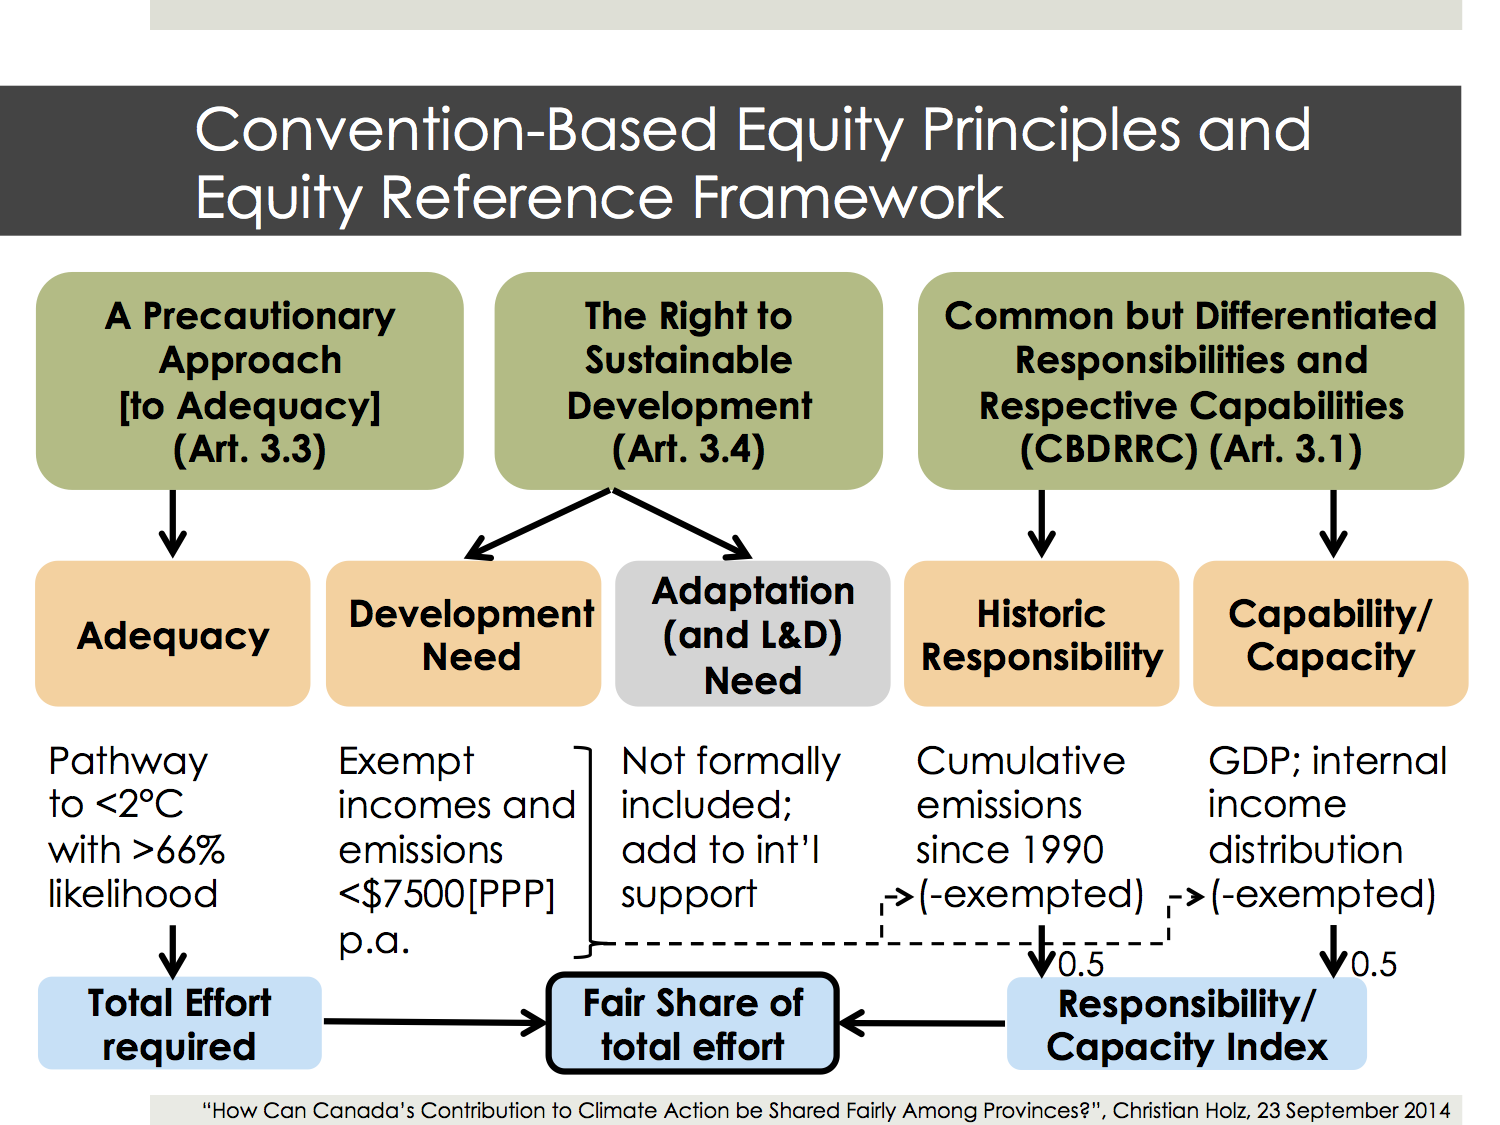
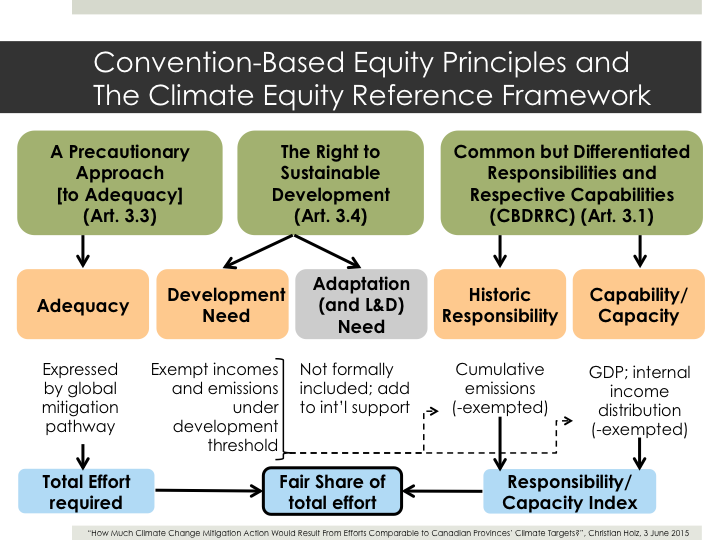
Don’t worry, I won’t be covering all of this. This schematic is just to demonstrate how the Climate Equity Reference Framework starts off from the equity principles that are explicit and implicit in the UN climate convention and constructs from there a methodology that can calculate for each country (or in my case: for each provinces) FAIR SHARES of the overall global effort needed to address the climate crisis.

For this presentation we don’t really need to know how this works in detail, but I am happy (in fact, delighted) to explain more afterwards.

In the end, part of the size of each fair share is determined by HISTORICAL RESPONSIBILITY for creating the climate crisis and the other part by the level of CAPACITY for solving it. Today, only capacity is of interest to us.

2015-06-03_ESAC-Panel8-CHOLZ__Slide04

The notion of capacity relates to the notion that it can be said to be fair to expect countries to do more if they have more money – in other words, a higher GDP.

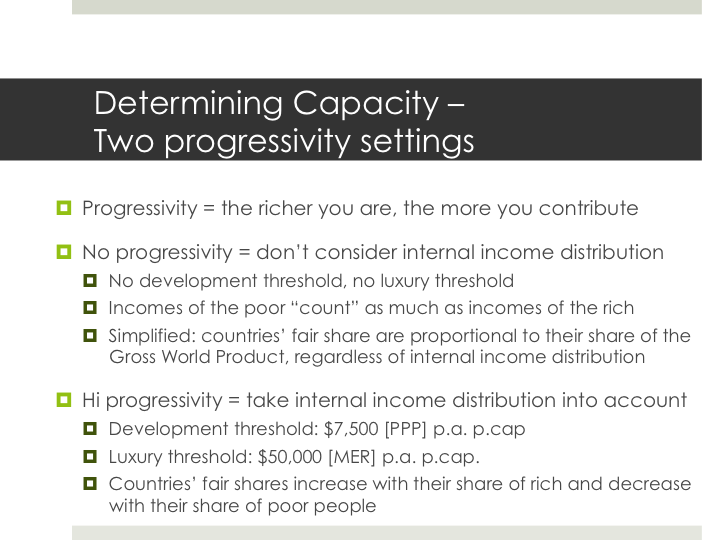
However, we can argue that GDP is only half of the picture and we need to also take internal income distribution into account when determining countries’ (or provinces’) capacity to mobilize means to fight climate change. And this is where PROGRESSIVITY comes into play. Essentially, progressivity means that the richer you are, the more you are expected to pay towards things like roads, health care, education, or in our case, addressing the climate crisis.

When thinking about a country’s capacity, we have to think about progressivity because we cannot reasonably expect to mobilize the incomes of the very poor for climate action because those incomes are needed to lift people out of poverty etc.

In the analysis here, I will be contrasting two specific cases: no progressivity and high progressivity. In the no progressivity case, internal income distribution is ignored, or in other words, every singly dollar of income is counted towards that country’s capacity regardless whether that dollar is earned by somebody who makes one dollar a day or ten thousand. In other words, if we estimate the global cost of climate action to be, for example, 1% of GWP, every country would have to contribute 1% of its GDP to climate action.

In contrast, the high progressivity case that I use here, has a “development threshold” below which we do not count incomes towards capacity as they are associated with poverty eradication and such. Only income above that threshold DOES count, and how much it counts slowly increases up to the “luxury threshold” above which all income is counted toward the country’s capacity. So this scenario DOES take internal income distribution into account and a country with more poor and less rich people will, as a result, have a smaller fair share than one with more rich and less poor people.

2015-06-03_ESAC-Panel8-CHOLZ__Slide05

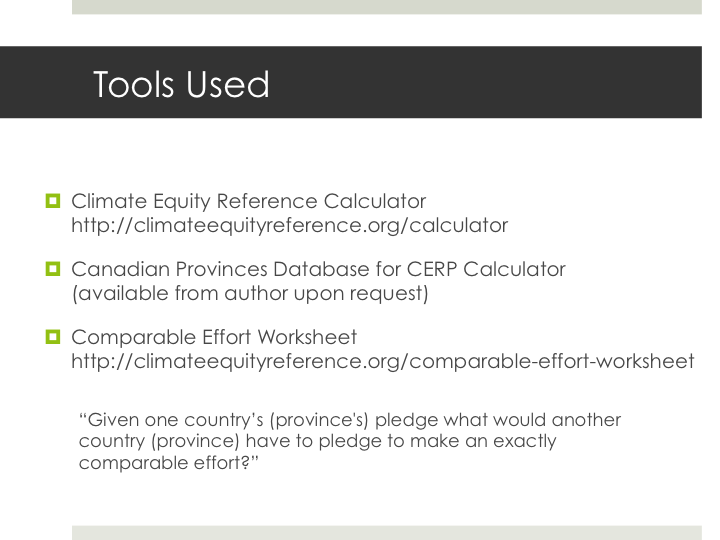
After this bit of background, we can now look at results. In order to get those, I have been using the Climate Equity Reference Calculator, which is an easy to use online tool, where users can explore their own preferred parameterizations of equity.

I am using the calculator with a custom database where I replaced Canada data with provincial data to look at provinces in the context of global mitigation.

For this analysis today I am also using the Comparable Effort Worksheet, which is an interactive tool that I developed to leverage output from the Calculator to compare the pledges that countries are making in advance of the Paris climate summit later this year. Again, this is available online and users can explore the different equity parameterizations.

The comparable effort worksheet essentially is answering the question

“Given one country’s (or province’s) pledge what would another country (or province) have to pledge to make an exactly comparable effort?”

… this can be answered be expressing the first country’s or province’s pledge as a fraction of what its fair share should be and then applying that same fraction to the fair share of the other country.

2015-06-03_ESAC-Panel8-CHOLZ__Slide06

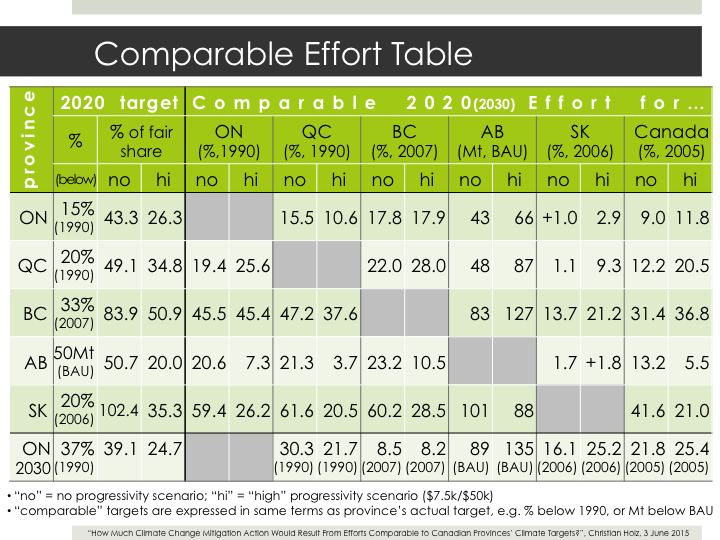
Alright, so let’s look at this in practice. Here, in the table I have a subset of provinces that have stated a 2020 target.

These data allow for interprovincial comparison of targets, so let’s do that, starting with Ontario’s 2020 target – 15% below 1990 levels. Now these next two columns show us, what percentage of Ontario’s FAIR SHARE this target represents under each of our equity scenarios – no progressivity and hi progressivity.

Two things jump out on us.

  • First, the share is higher in the no progressivity case. This is one of the interesting things to note and is like this all across the board in rich countries. The reason is, that in a no progressivity case, where the income of the poorest are utilized just as much as the income of the rich, poorer countries have to bear comparatively larger share of the overall effort than in the hi progressivity case, and as a result, richer countries get away with less.
  • The other thing stand jumps out is that in both of these scenarios, Ontario falls waaaaay short of its fair share. This is because of a feature of the framework that I haven’t mentioned yet, which is that this approach explicitly refuses to be biased by realpolitik-driven questions of how much mitigation can “realistically” be undertaken within a country.
    As a result, for rich countries, we get fair shares that typically far exceed their mitigation potential, which means that some of the mitigation that this country is responsible for has to be carried out in other places through international cooperation.
    So in order to bring it’s target in line with its fair share, Ontario would have to ensure that emissions equivalent to roughly another 1 to 3 times of what it indents to do at home, is done in other countries through international cooperation.

But for comparing provinces with each other we can ignore this part for now.

Alright, so let’s look across the table to compare other places with Ontario.

  • In order for Quebec here to be as ambitious as Ontario, it would have to be taking a 15% or 10% target, which makes sense intuitively – the 15% is pretty much an exact match of Ontario’s target in a no progressivity case, and when we take into account differences in internal income distribution, as the hi progressivity case does, Quebec doesn’t have to stem as big of a contribution as Ontario since Quebec has more people below the poverty threshold and less above the luxury threshold.
  • As we move further across the table, we notice another very interesting thing, perhaps somewhat unexpected: in pretty much every case, the target that a province (and Canada as a whole) would have to take to match Ontario’s ambition is SMALLER than the target they actually proposed, which helps us identify Ontario’s target as one of the weakest.

Ok, let’s look at another few interesting things here. I should point out BC’s target and the fact that it is the highest share (with the partial exception of Saskatchewan, which I’ll get to in a moment) of its fair share, in both progressivity scenarios.

This is a conclusion that we couldn’t have reached just by comparing the percentages (mainly because of the different base years involved).

There are two reasons for that. One is that the BC target really is comparatively good, but the other one, importantly is that this effort sharing framework conceptualizes effort viz-a-viz baselines, and in this case a some of the GHG implications of the Clark government’s natural gas aspirations are included, so the effort of reaching the 33% target is measured against that, upward pointing, baseline.

There is much more interesting stuff in here, but the one last I want to point out is the 102% for Saskatchewan.

This essentially means that Saskatchewan’s target is so ambitious that it actually proposes to do MORE than its fair share. I said earlier, that this approach can be used to identify leaders and laggards, so here we have our leader, right? Well, it depends how you think about equity – if you compare the high and no progressivity cases, you see that Saskatchewan’s figure actually is pretty much in the middle of the field if progressivity is taken into account.

So only in the context of a global effort-sharing regime in which the world’s poor are expected to do what I would consider to be an unreasonably and unfairly large share of the effort, would Saskatchewan qualify as a leader.

2015-06-03_ESAC-Panel8-CHOLZ__Slide11

Ok, so now let’s look at some other way we can think about analyzing provincial targets under an effort sharing regime. Instead of asking, as we have thus far, “what if other PROVINCES would match a provincial target?” we can ask what if ALL other COUNTRIES would match that target. Then we would get a corresponding global ambition level, which, in turn, we can compare, for example, with a 2°C compatible global trajectory.

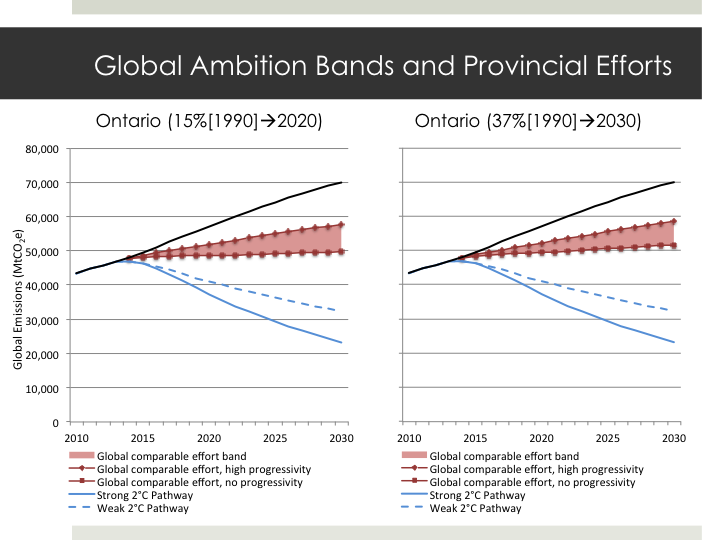
This is what these graphs do, with Ontario’s 2020 target on the left and its 2030 target on the right. In the chart, we have global business as usual projections in black and in blue two reductions trajectories for less than 2°C warming. The red wedge is the “global comparable effort band” that shows how much global effort we’d get if countries would match Ontario in a high progressivity (at the top) or no progressivity (bottom) effort sharing regime.

Clearly, this is by far not enough to stop warming below 2°C. Interestingly, if we compare these two, we see that the 2030 target has even slightly less global ambition than the 2020 target, so in terms of thinking of targets as fractions of a FAIR SHARE, Ontario has actually been LOWERING its ambitions with its brand new target.

The other thing, and I mentioned this before, is what that means for our 2°C trajectory. It could mean that Ontario has to go deeper at home or it could mean that more mitigation has to happen elsewhere – and here the crunch question is whether we expect other places to do more than their fair share, or, whether Ontario embraces its fair share and finances further mitigation abroad. The right answer is probably a combination of doing more at home and investing in mitigation abroad.

2015-06-03_ESAC-Panel8-CHOLZ__Slide12

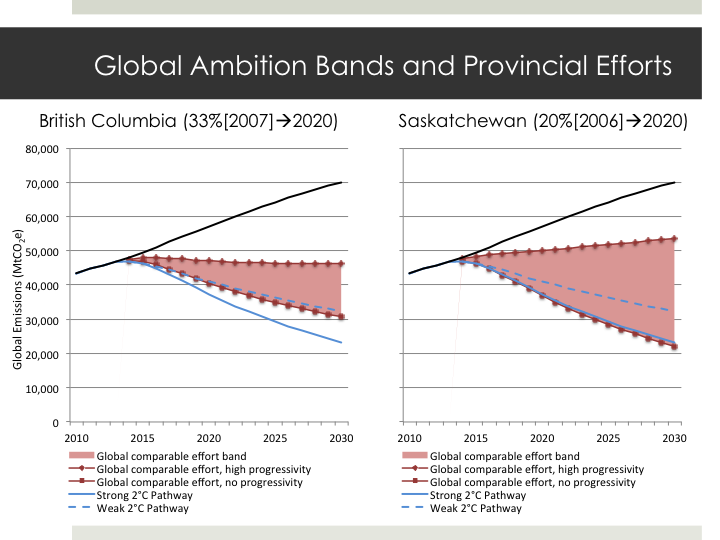
Here are two more of those, and here I want to focus on Saskatchewan again. We can see again that it actually is plausible to say that Saskatchewan’s target is compatible with a stringent global mitigation pathway, but only if seen in the context of a hardly defensible equity setting. [You can’t see it from the graph but there is another factor at play here and that is Saskatchewan’s extremely high per capita emissions – in fact, if Saskatchewan were a country it would have the highest per capita emissions in the world. So mitigation in Saskatchewan always implies relatively high per capita emissions reductions, which, if matched everywhere, would lead to quite some serious global mitigation.]

2015-06-03_ESAC-Panel8-CHOLZ__Slide13

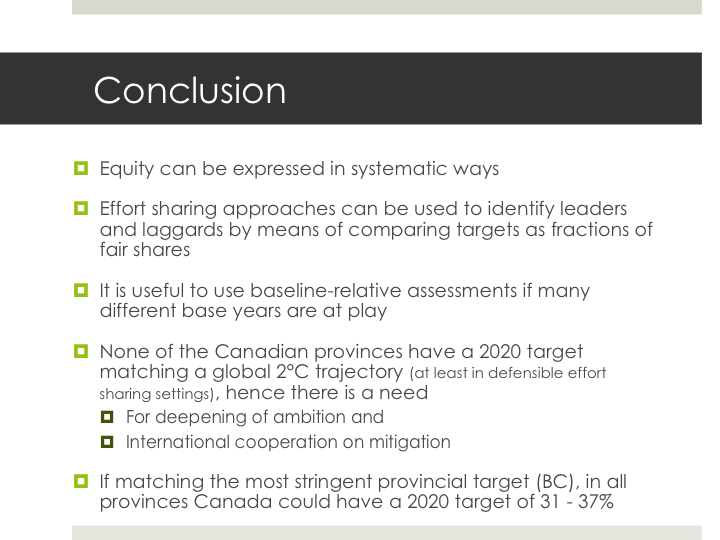
To conclude, what I hope I could demonstrate here, is that equity in climate mitigation can be systematically operationalized and be usefully applied to assess targets and pledges. Specifically, we can use effort sharing approaches to compare climate targets across entities, by thinking of them as fractions of those entities’ fair share, in other words, how much of what those entities SHOULD be doing are they proposing to ACTUALLY do?

This can then be used to identify laggards and leaders, which, importantly, is even true if different base years are in play in the comparison.

Looking specifically at Canadian provinces we can see that none of the provinces that I considered here has a target that is compatible with a global 2°C trajectory so we need to see a deepening of those targets and, since rich countries typically cannot discharge all of their fair share domestically, a serious investment in helping other countries get on a low or zero carbon development pathway.

Finally, we can see that if all provinces would match the most stringent target, their efforts would be substantially deepened – so much so that Canada as a whole could double its 2020 target.

Canada’s climate target is a smokescreen and full of loopholes

By , 25 May 2015 22:26

This article was originally published on The Conversation.
Read the original article.

Christian Holz, University of Ottawa

This month Canada’s federal government revealed the contribution that Canada intends to make towards a new global climate deal – 30% below 2005 levels by 2030.

On first glance, the target appears to be stronger than most observers of Canadian climate policy would have expected. Prime Minister Stephen Harper had earlier declared that Canada’s contribution would be “of similar levels of ambition to other major industrialised countries”.

However, closer scrutiny reveals that the target has major flaws. It is very unlikely that Canada will see a 30% reduction of domestic greenhouse gas emissions as a result of the pledge.

What’s in the target

Compared to 2005, the target would reduce emissions by 220 million tonnes of CO2-equivalent by 2030.

Canada plans to do this through fuel efficiency regulations, regulating hydrofluorocarbons (HFCs; less than 1% of Canadian emissions), limiting methane emissions from the oil and gas sector and addressing non-CO2 emissions from natural gas-fired power plants. All of these are important steps.

The cover note of the pledge also points to the fact that, in a federation such as Canada, every level of government has to play its part. Indeed, as we will see, there is a strong expectation on the part of the federal government that it is in fact the provincial governments that will achieve most of these promised reductions.

Creative accounting

Canada’s submission also specifies a new method of accounting for emissions from forestry and land use, which decreases the reduction Canada needs to make.

In previous years, the stated intention was to use a so-called reference level approach (which I discussed here) to calculate the sector’s contribution to the Copenhagen target. This was last estimated to result in 19 million tonnes worth of credits in 2020.

Meanwhile the new approach is estimated to yield a much higher credit, around 63 million tonnes, without any change in climate policy.

Further, a secret internal briefing memo prepared for the federal cabinet and seen by this author, estimates that the current oil price slump and the associated slow down in economic activity in some sectors, especially oil and gas, will result in a 30-million-tonne reduction in 2030 emissions, again without any actual federal climate policy.

Finally, the indication to use international offsets is a fundamental shift in the Harper government’s approach – Harper himself called international offsets “hot air”. When Canada withdrew from the Kyoto Protocol it was hinted that the reluctance of the government to meet its targets by purchasing international credits was a main reason for the decision.

In the previously-mentioned cabinet memo, the envisioned volume of offset purchases in 2030 is pegged at 33 million tonnes of CO2-equivalent – again without any changes in Canada’s domestic emissions profile. It is important to remember that international cooperation on climate change mitigation – and offset projects can represent such cooperation – is a crucial component of the overall response to climate change.

However, most of this cooperation must be realized in addition to, and not instead of, stringent domestic mitigation.

In total, of the 220 million tonnes of CO2-equivalent of emission reductions implied by the 30% target, up to 126 million tonnes of CO2-equivalent can therefore already be achieved without any actual changes to domestic climate policy.

Leaving provinces to go it alone

The current Canadian government has elected to pursue a sector-by-sector regulatory approach to climate policy, rather than, for example a market-based economy-wide one.

In practice, however, the only sectors regulated so far are vehicle fuel efficiency and coal-fired power generation, with a standard that will not be fully implemented until 2062.

At the same time, the Province of Ontario has already completely phased out coal fired generation, from a share of 27% of electricity generation in the early 2000s, highlighting a disconnect between federal and provincial policy approaches to climate change.

Canada’s Commissioner of the Environment and Sustainable Development, a part of the office of Canada’s Auditor General, concluded that there is strong evidence that Canada will fail to meet its 2020 target because of the federal government’s failure so far to “have an overall plan that maps out how Canada will achieve this target … or to provide the necessary coordination so that all levels of government … can achieve the national target”.

Instead of providing such coordinating role, the Canadian federal government is instead heavily leaning on the provincial governments to implement effective climate policy of their own.

In fact, in their briefing note to cabinet, federal bureaucrats estimated that as much as 89 million tonnes of the total 220-million-tonne Canadian reduction target could come from provincial efforts.

However, the most striking example of the sector-by-sector approach’s limitations is the fact that the federal government has repeatedly announced its intention (see here, here, here and here) to regulate the oil and gas sector since 2006 and has now dropped any plans for policies to address greenhouse gas emissions from this sector.

Environment Minister Leona Aglukkaq highlighted these intentions in her speech at the 2013 United Nations climate summit in Warsaw, but during her speech at the UN climate talks the following year, any references to her government’s intentions with regards to oil and gas were absent.

Oil sands missing in action

This brings us to the third major flaw in Canada’s INDC, the failure to address the fastest growing source of greenhouse gas emissions, the oil sands.

Oil sands emissions are expected to increase fourfold between 2005 and 2030 (by about 102 million tonnes), but there are no plans to regulate the sector.

As the fastest growing source of emissions, the oil sands represent an important test of the sincerity of the government’s intentions with regards to climate policy.

It is implausible to assume an emissions trajectory for Canada which is in line with global emissions pathways that are compatible with holding warming to 2C or less in which oil sands emissions are not addressed.

In fact, in recent years emissions growth in the oil and gas sector more than cancelled out any emissions reductions undertaken in other sectors of the economy. This included Ontario’s coal phase-out which is routinely characterized as “the single largest greenhouse gas reduction initiative in North America”.

Projected Changes in Canadian Greenhouse Gas Emissions through 2030. (Data Sources: Environment Canada: Emissions Trends 2014 and First Biennial Report)
Note: some of the expected growth of the oilsands sector is masked by an expected decline of conventional oil and gas extraction

Author provided

Stopping free-riders

In aggregate, these observations suggest the Canadian pledge will result in much fewer real emissions reductions and long term climate and energy policy intervention than a quick glance at the top-level figure of 30% would suggest.

It is consistent with the track record of the current Canadian government whose stated approach to climate policy has been characterized by the Auditor General’s office as failing to meet the current reduction target for 2020.

In a federation, the minimum role of a federal government is to ensure fairness between its subnational entities and overall ambition of the country by restricting free-riding by parts of the country or sectors of the economy and by providing a common framework of minimal standards.

Judging from Canada’s pledge and the plans and considerations associated with it, this is not the approach of Canada’s federal government. Instead it appears intent to erect a smokescreen to shield the view from its unwillingness to address emissions from the largest growing source of emissions, the oil sands.

The Conversation

Christian Holz is SSHRC Postdoctoral Fellow, School of Political Studies at University of Ottawa.

Harvested Wood Products accounting comes to Canada’s National Inventory Reports

By , 21 April 2015 10:46

To start with a guessing game, imagine Canada’s greenhouse gas profile and think about the TOP3 polluting sectors. Clearly, the Oil and Gas Industry and Transportation are in the TOP3, but which is the third sector at the top of Canada’s profile…? Electricity generation? Energy Intensive Industry like Aluminum or Steel? (Well, I realize the title of this post is a bit of a spoiler, but otherwise) I bet you wouldn’t have guessed that one right, right?

Every year, Canada (as well as all other rich countries) have to submit reports to the United Nations climate agency, the UN Framework Convention on Climate Change, or UNFCCC, detailing how much greenhouse pollution they have emitted in the year that ended about a year and a quarter before (e.g. in April 2015, data for 2013 is submitted). This year, a bunch of carbon accounting practices have changed, including this one:

One of the bigger and important accounting change in the 2015 National Inventory Report (NIR) is around the issue of Harvested Wood Products (HWP). Climate Action Network fought long and hard against this weird accounting practice back before (and during) the Copenhagen climate summit in 2009 but ultimately lost. In a nutshell, the thinking behind HWP is the idea that strictly speaking the carbon that is stored in trees does not get released to the atmosphere when the trees are cut down (or “harvested”) but only when the HWPs are destroyed/combusted. Think lumber for building or furniture: the carbon actually continues to be stored; just not in the tree trunks but rather in the lumber frame of houses or in the chair you’re sitting on. Or books: the carbon is now on your shelf. The problem with this of course is that the tracking of the carbon in paper or 2x4s is not particularly reliable, to say the least, so any inventory of HWP emissions rely heavily on models and their assumptions unlike cutting of actual trees, which can be measured directly.

Amount-wise, this is pretty huge. Looking at the 2015 NIR that Canada submitted last Friday, the HWP emissions for 2012 were 150Mt CO2, or over a quarter of Canada’s total CO2 emissions that year (or roughly a fifth of CO2eq). Comparing these 2012 numbers from the 2015 NIR to those from the 2014 NIR (where HWP accounting wasn’t used yet), allows us to see the impact of HWP accounting on the entire land use, forestry and agriculture (LULUCF) sector (there are other changes too, but HWP is the biggest one): in NIR2014, the LULUCF total for 2012 was 41Mt, in NIR2015 the total for the same year is 60Mt. However, looking at Forest Land, this has flipped from being a 32Mt emissions source to a 94Mt carbon sink, most of the difference now being captured by the somewhat hard-to-understand HWP sub-sector, which is now an emissions source (in 2012) of a whopping 150Mt (see images below for a comparison of the 2014 and 2015 tables for LULUCF emissions in 2012). That’s not a small number! In fact, it makes HWP the third largest sector of the Canadian economy by amount of greenhouse gas emissions, after Oil and Gas extraction and Transportation!

Old: 2012 Land Use, Land Use Change and Forestry Emissions in the April 2014 Canadian NIR

Old: 2012 Land Use, Land Use Change and Forestry Emissions in the April 2014 Canadian NIR

New: 2012 Land Use, Land Use Change and Forestry Emissions in the April 2015 Canadian NIR

New: 2012 Land Use, Land Use Change and Forestry Emissions in the April 2015 Canadian NIR

I think the main problem with this change is transparency and accountability: it’s pretty easy to conceptualize forests as an emissions source (more trees chopped down than growing, releasing more carbon than they suck up) with pretty clear and easy leverage points for policy interventions. Further, this accounting change turns the forestry sector from a source into a sink, as a result of which we might conclude that the forestry sector is doing quite well and lose sight of it as a sector in which we need to change practices and policies as part of our overall climate mitigation strategy – not a good idea! On the other hand, it is plausible that HWP accounting makes visible possible leverage points for policy interventions there; e.g. around lumber recovery for construction sector, paper/wood fibre recycling etc to get emissions from that sector down…

Comparable Effort Worksheet

By , 24 March 2015 10:16

With the question of ambition and comparability of efforts looming large in the upcoming period of countries putting their cards (aka “Intended Nationally Determined Contributions”, or INDCs) on the table with regards to their envisioned climate pledges for the December 2015 Paris Climate Summit, I have been working on a tool to answer the question “If a country A suggests a certain level of effort for itself, what would be the equivalent effort of country B?” (I will call country A the Reference Country and its pledge shall henceforth be known as the Reference INDC).

The purpose of this exercise is to make pledges comparable across countries to be able to identify leaders and laggards/freeriders. In my particular tool, I am using the conceptual framework of the Climate Equity Reference Project, which allows me to think about the Reference INDC as a fraction of what would be the Reference Country’s fair share contribution to the global effort to stem the climate crisis. An comparable effort, or equivalent effort, of country B would then be an INDC that represents the same fraction of country B’s fair share contribution.

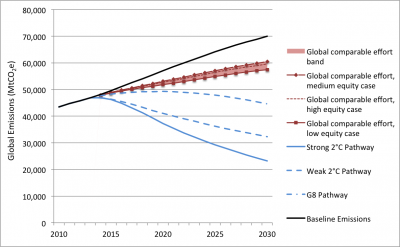
Since in the current world, an assessment of INDCs unfortunately is always an assessment of the collective inadequacy of the global response to the climate crisis, the tool starts out with an assessment of the question “how would we do, globally and in comparison to the emissions trajectories that we ought to be on, if every country would make an effort comparable/equivalent to the Reference INDC”. Here is a screenshot of that assessment from the tool using the EU’s INDC as Reference and the help text that the tool provides for interpreting the chart:

EU-Reference-Global-Inadequacy-Chart

Prior to assessing comparable efforts based on the Reference INDC, it is prudent to assess the global ambition gap associated with the Reference INDC. For most, if not all, INDCs it is expected that there will be a substantial shortfall in ambition compared to the global mitigation trajectory required Therefore, any comparable effort analysis, as that presented in section 4 below, will virtually always be an analysis of comparable inadequacy of INDCs.
Consider the case of the Reference INDC of EU 28 here. As calculated in the table (in section 2) above, this INDC is expected to lead to mitigation of 2,006 Mt below BAU in 2030. Given that the total fair share obligation of EU 28 is between 7,528 Mt and 9,894 Mt, according to the scenarios considered here, the Reference INDC is equivalent with proposing to meet only between 20.3% and 26.6% of this total fair share obligation.
If every country in the world would likewise put forward INDCs that are equivalent to between 20.3% and 26.6% of their own total fair share obligation, the resulting overall global ambition (or “Global comparable effort”) would be as indicated in the chart below. For example, in 2030, the resulting range of global comparable mitigation effort would be 9,477 Mt to 12,455 Mt, compared to the overall mitigation need of 46,737 Mt for the Strong 2°C Pathway. Clearly, it can be seen that the overall global mitigation achieved in this scenario would still leave a large shortfall, even if one takes the lower edge of the global comparable effort band. (The 2,006 Mt mitigation implied by the INDC of EU 28 is only 4.3% of the 46,737 Mt of mitigation required to reach the Strong 2°C Pathway.)
(For more information on assessing the global mitigation implications of individual INDCs and for interpreting the shortfall, see the note “Comparable Efforts in a Low Ambition World”, http://climateequitereference.org/2015/03/13/comparable-effort-in-a-low-ambition-world)

The tool is implemented in Excel (but don’t let that discourage you from trying it; I really tried to make it really user friendly and there is plenty of documentation and instruction in the file and really only a tiny bit of user input required: essentially just 3 bits of information about the Reference INDC). There are also a number of pre-populated versions of the tool available for your most convenient start with using it. Those are hosted over on the Climate Equity Reference Project website.

Let me know what you think: cholz@climate.works

How Can Canada’s Contribution to Climate Action be Shared Fairly among Provinces?

By , 10 October 2014 16:06

[This is a summary of a talk that I gave on September 23, 2014 at the University of Ottawa’s Centre of International Policy Studies, audio of the talk is available on their site]]

((The author of this post welcomes any inquiries or feedback with regards to this post at cholz@uottawa.ca)), ((The research presented here is part of my postdoctoral research project, funding for which comes from the Social Sciences and Humanities Research Council (SSHRC). The calculations presented here make heavy use of the Climate Equity Reference framework, developed by Paul Baer, Tom Athanasiou, Sivan Kartha and Eric Kemp-Benedict, and their Climate Equity Calculator. The database used for the calculations is a heavily altered version of their Climate Equity Calculator Database, augmented for the Canadian calculations with data from Statistics Canada (for population [1], [2], Gini efficients [3] and historical GDP data [4]), The Conference Board of Canada (for GDP forecasts [5]–[7]), Environment Canada (for historic [8] greenhouse gas emissions data). The “no policies” emissions baselines are constructed using historic data from Environment Canada [8] and emissions projections from Natural Resources Canada [9] and Environment Canada [10].)) Climate change mitigation necessitates effort sharing. Consequently, one of the most crucial questions for climate change politics is: How can different political entities fairly share the overall effort to reduce greenhouse gas emissions? On the global scale, the overall effort must be shared between countries or groups of countries. In political federations, such as Canada, provinces and territories must decide how to share the overall undertaking of reducing greenhouse gas emissions. Arguably, the current failure of Canada to live up to its international climate commitments [11], [12] can be at least partially attributed to the break-down in federal-provincial-territorial dialogue on climate change in the early 1990s [13], [14]. In a recent talk (slides here), co-hosted by CIPS and IPEN, I presented some early results from my current research that aims to help reinvigorating this dialogue by applying some of the lessons learned from the mature discourse on effort sharing on the global level to the Canadian inter-provincial effort sharing context.

Specifically, the aim was to investigate which insights the application of the Climate Equity Reference framework to the Canadian case could provide. In order to address this question, I will quickly explain the framework before talking about lessons for the Canadian case. In a nutshell, this framework, a recent generalization of its better known predecessor, Greenhouse Development Rights [15]–[17], takes explicit design clues from the equity principles of the UN Framework Convention on Climate Change [18] and translates them into specific equity indicators that can be further operationalized through readily available data for calculations of “fair shares” of countries to the global effort (Figure 1). While the framework itself is agnostic about the specifics of such operationalizations, the starting point is a global emission reductions pathway which determines the overall effort required collectively from all countries. It is important to note that in this approach the effort, both globally as well as for individual countries, is expressed relative to a “no policies” baseline, which describes a counter-factual future in which no single climate policy measure will ever be, or has ever been, implemented.

For each country, then, its percentage share of the overall global capacity that can be justifiably mobilized for action on climate change is calculated; conceptualized as all incomes above a certain threshold, in my case $7500PPP annually per capita. Likewise, the percentage share of the overall global responsibility for creating the climate problem is calculated for each country, conceptualized as the cumulative emissions from a certain start date, in my case 1990. These two figures are then combined into a Responsibility-Capacity-Index, in my case with equal weight, which is essentially a country’s share of the world’s collective responsibility for the creation of the climate problems and it’s collective capacity to act to resolve it. This percentage share can then be applied to the overall global effort required to arrive at a country’s “fair share” as defined by the specific operationalization chosen. ((For a more detailed treatment of the relationship between the climate convention’s core equity principles and operationalizable equity indicators, see [19]. For discussions on different options for operationalizing equity indicators, e.g. different responsibility start dates, development income thresholds etc., see [20], [21], [17], [15]. For more information on the very stringent emissions reductions pathway chosen here, that can still just about be defended as techno-economically feasibly, see [22], [23]))

Figure 1: The Climate Equity Reference approach (Slide from September 23 Presentation)

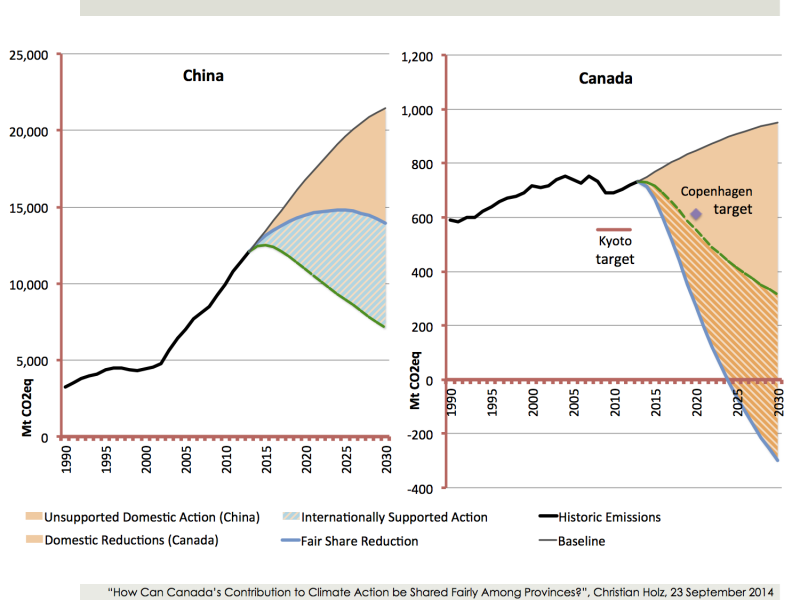
When plotting country’s fair shares against their “no-policy” baselines, it becomes clear that there is a group of countries, including Canada, that have a high level of responsibility and/or capacity and therefore their fair share contribution would be larger than the amount of emissions reductions that could feasibly be implemented within their own borders (Figure 2, right panel). In order to nevertheless embrace their fair share, under this framework, these countries would have to ensure emissions reductions in other countries whose fair share, that is reductions they would be expected to undertake with their own means, is less than the level of emissions reductions that could be conceivably undertaken there (Figure 2, left panel illustrates that case). Such “internationally supported action” could take many forms, but essentially entails an entity from the first type of countries, governmental or non-governmental, providing support for emissions reductions in the second type of country, through financial or technology transfers, capacity building, enactment of enabling policy environments, direct foreign investment etc. ((With regards the dotted green line which delineates domestic effort and provision of international support for countries like Canada and indicates the overall emissions reductions (independently implemented as well as internationally supported) for countries like China it is important to note that the line is for illustration only and is drawn by applying the relative reduction below the baseline that the global case requires to the individual countries. In practice, this line would probably reflect different cost levels of emissions reductions, different reduction potentials as well as considerations of sovereignty and domestic politics for both supporters and recipients of international support, among other considerations.))

Figure 2: Contrasting China’s and Canada’s “Fair Shares” (Slide from September 23 Presentation)

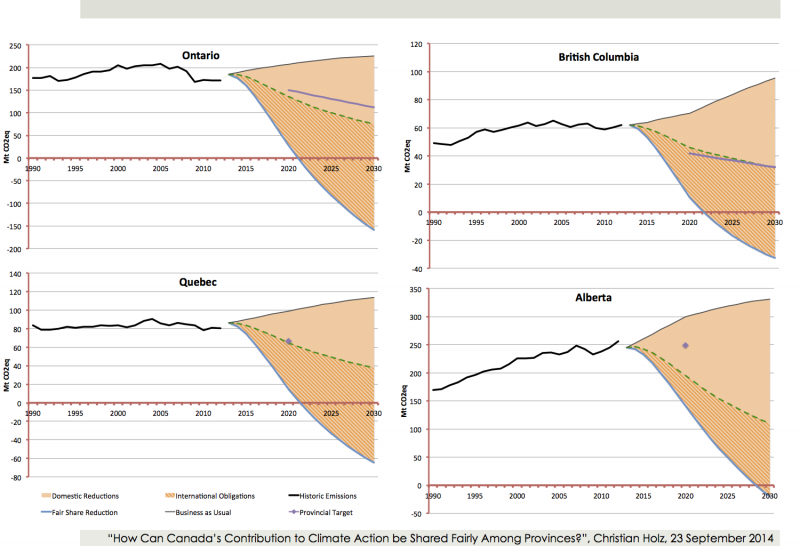
Turning the attention now to the application of this approach to effort sharing among Canadian provinces, the first set of results (Figure 3) is derived from treating all ten Canadian provinces (plus the territories) as if they were independent entities within a global context and replacing the entity “Canada” with these eleven subnational entities in the calculations. There are three main take-homes from this set of results.

First, which is not surprising if we think about it from a responsibility and capacity perspective in a global context, all Canadian provinces have a fair share that is too large to discharge within their own borders – notice how all of the “fair share” trajectories dip below zero. In other words, in addition to domestic action, all provinces will have to ensure that additional emission reductions are undertaken elsewhere on the planet, by providing enabling support for that.

Second, we can see the specific effects of the approach to conceptualize overall effort as the effort to deviate from a counter-factual “no policies” baseline: Because in the case of Ontario and Quebec the baseline is one of relative modest future emissions growth, their fair shares go much deeper into the negative than Alberta or BC, both of which have stronger emissions growth baselines. This implicitly takes into account that it is harder to cut emissions in absolute terms in places where there are economic drivers that push into the opposite direction. In this context it is important to keep in mind, that these are counterfactual baselines of a future in which no climate policies have ever been implemented. In reality, all these provinces actually have already undertaken some climate actions and certain federal policies that are already having, or are expected to have, an impact on emissions. In other words, some of the domestic effort expected from provinces is already already realized in the current policy configuration.

The third important take home is related to the provincial targets (the purple lines and dots in Figure 3): In many cases the provincial targets are actually close to what this analysis would expect provinces to accomplish within their own borders. That means in the case of the provinces where this actually is the case, the main conclusion is that the international support dimension would need to be added to the overall provincial undertaking.

All this shows that we can use a formalized model of global effort sharing to draw interesting conclusions for what each Canadian province should be fairly expected to contribute to a global effort. To my knowledge this has not been done before and I think can greatly help the discussion about effort sharing in Canada.

Figure 3: Selected Canadian provinces treated as independent entities in global context (Slide from September 23 Presentation)

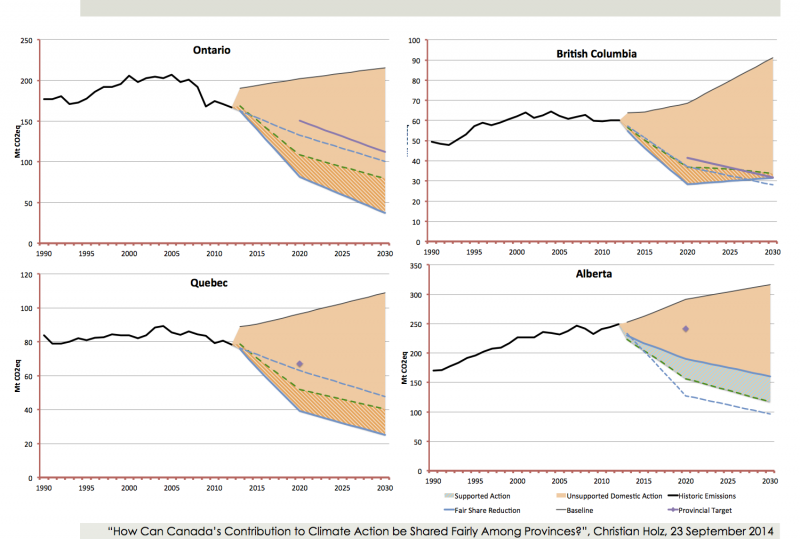
However, the model also allows for analysis of Canada in isolation, for example by examining effort sharing between Canadian provinces and territories of a domestic Canadian target. Figure 4 shows the results of such an analysis for the same set of provinces. Since the federal government has not announced such a domestic target for Canada for the post-2020 period, I am using here the only Canada-wide emissions trajectory that is currently on the table federally, that contained in the NDP’s private member’s bill C-619. ((C-619 contains a mid term target of 35% below 1990 for 2025 and 80% below 1990 as a long-term target for 2050. Since C-619 is the third incarnation of Jack Layton’s original climate change accountability act, C-377, I assume that the authors of the bill are still embracing the 2020 target from C-377, 25% below 1990, especially since the 2025 target in C-619 lies on a straight line from that 2020 target to the 2050 long-term target that both versions of the bill share. The trajectory from 2025 to 2030 is also derived from that same straight line.)) The drawback of using the Climate Equity Reference framework to analyze Canada in isolation is that it cannot be assessed whether the resulting overall effort is actually sufficient to address the climate crisis since that is a function of the actions of all countries and not Canada alone. With that caveat, we can look at how that domestic Canadian emissions reductions objective could be shared among provinces.

The graphs clearly show that in the same group of four provinces, Alberta (along with Saskatchewan, Nova Scotia, and New Brunswick) does now belong to a different category than the others. Specifically, we can say that the fair share of this category of provinces, when taking into account historical responsibility and capacity, is less than what they would be under a uniform application of the same reduction rate – as represented by the dotted lines. ((The green dotted line applies the pan-Canadian target to provinces as specified by bill C-619: as same percentage reductions for each province below its own 1990 base year level of emissions. The blue dotted line applies the same reduction relative to the “no-policies” baseline that the bill implies for the whole of Canada to each province’s “no-policies” baseline.)) On the other hand, in places like Ontario, BC and Quebec (as well as Manitoba ((New Foundland and Labrador falls in its own category in that “domestic” reductions and fair share match, while data for the Territories is inconclusive.))), this assessment of fair shares under consideration of responsibility and capacity would require these places to do more than if a uniform reduction rate were applied to their baselines.

In the absence of other countries in the model, these results are a bit less straightforward to interpret than in the global case. But essentially this could mean two things: either the shaded areas are conceptualized just as in the global case as action that takes places in one province (here: Alberta et al.) but is enabled, for example by financial or technology transfer, by another province (e.g. Ontario, Quebec or BC). Alternatively, the shaded areas could be ignored and every province would be required to ensure that their own fair share reduction is realized within their boundaries, which seems to be the more appropriate application in the Canadian case.

Figure 4: Selected Canadian provinces’ fair share of a domestic Canadian emissions reduction effort (Slide from September 23 Presentation)

Either way, the application of a strictly equity-centered approach to effort sharing in Canada clearly can enhance the discussion of how a Canadian effort can be shared among its provinces once Canadian governments decide to re-establish a federal-provincial-territorial dialogue on climate change.

REFERENCES

[1] Statistics Canada, “Table 052-0005 – Projected Population, by Projection Scenario, Sex and Age Group as of July 1, Canada, Provinces and Territories, Annual (persons X 1,000), CANSIM (Database).” 25-May-2010 [Online]. Available: http://www5.statcan.gc.ca/cansim/a47. [Accessed: 12-Mar-2014]
[2] Statistics Canada, “Table 051-0001 – Estimates of Population, by Age Group and Sex for July 1, Canada, Provinces and Territories, Annual (persons), CANSIM (database).” Statistics Canada, 25-Nov-2013 [Online]. Available: http://www5.statcan.gc.ca/cansim. [Accessed: 07-Mar-2014]
[3] Statistics Canada, “Table 202-0705 – Gini Coefficients of Market, Total and After-Tax Income, by Economic Family Type, Annual (number), CANSIM (database).” Statistics Canada, 27-Jun-2013 [Online]. Available: http://www5.statcan.gc.ca/cansim. [Accessed: 07-Mar-2014]
[4] Statistics Canada, “Table 384-0038 – Gross Domestic Product, Expenditure-Based, Provincial and Territorial, Annual (Dollars Unless Otherwise Noted), CANSIM (Database).” Statistics Canada, 08-Nov-2013 [Online]. Available: http://www5.statcan.gc.ca/cansim. [Accessed: 07-Mar-2014]
[5] Conference Board of Canada, “Provincial Outlook Economic Forecast: Autumn 2013,” The Conference Board of Canada, Ottawa, Jan. 2014 [Online]. Available: http://www.conferenceboard.ca/e-library/abstract.aspx?did=5937
[6] Conference Board of Canada, “Provincial Outlook Long-Term Economic Forecast 2013,” The Conference Board of Canada, Ottawa, 2013.
[7] Conference Board of Canada, “Canadian Outlook Long-Term Forecast 2013: Economic Forecast,” The Conference Board of Canada, Ottawa, 2013.
[8] Environment Canada, “National Inventory Report 2014,” Environment Canada, Gatineau, Apr. 2014 [Online]. Available: https://unfccc.int/files/national_reports/annex_i_ghg_inventories/national_inventories_submissions/application/zip/can-2014-nir-11apr.zip
[9] Natural Resources Canada, Canada’s Energy Outlook. The Reference Case 2006. Ottawa: Natural Resources Canada, Analysis and Modelling Division, 2006.
[10] Environment Canada, “Sixth National Communication to the United Nations Framework Convention on Climate Change.” 20-Dec-2013 [Online]. Available: http://unfccc.int/files/national_reports/non-annex_i_natcom/submitted_natcom/application/pdf/final_nc_br_dec20,_2013[1].pdf
[11] Commissioner of the Environment, “2014 Fall Report of the Commissioner of the Environment and Sustainable Development, Chapter1: Mitigating Climate Change,” Office of the Auditor General, Ottawa, Oct. 2014 [Online]. Available: http://www.oag-bvg.gc.ca/internet/English/parl_cesd_201410_e_39845.html
[12] Environment Canada, Canada’s Emissions Trends 2013. Gatineau: Environment Canada, 2013 [Online]. Available: http://ec.gc.ca/Publications/default.asp?lang=En&xml=1723EA20-77AB-4954-9333-69D1C4EBD0B2. [Accessed: 02-Mar-2014]
[13] D. Macdonald, J. Monstadt, and K. Kern, Allocating Canadian Greenhouse Gas Emission Reductions Amongst Sources and Provinces. Learning from the EU, Australia and Germany. Toronto: University of Toronto, 2013 [Online]. Available: http://www.environment.utoronto.ca/AllocatingGHGReductions2013/. [Accessed: 09-Sep-2013]
[14] C. Böhringer, N. Rivers, T. Rutherford, and R. Wigle, “Sharing the Burden for Climate Change Mitigation in the Canadian Federation,” Canadian Journal of Economics, forthcoming.
[15] T. Athanasiou, P. Baer, and S. Kartha, “Greenhouse Development Rights: An Approach to the Global Climate Regime That Takes Climate Protection Seriously While Also Preserving the Right to Human Development,” EcoEquity; Christian Aid, 2006 [Online]. Available: http://gdrights.org/wp-content/uploads/2009/03/gdrs_nairobi.pdf
[16] P. Baer, T. Athanasiou, S. Kartha, and E. Kemp-Benedict, “The Greenhouse Development Rights Framework. The Right to Development in a Climate Constrained World, Second Edition,” Heinrich Böll Foundation, Christian Aid, EcoEquity and the Stockholm Environment Institute, Berlin, Nov. 2008 [Online]. Available: http://www.ecoequity.org/docs/TheGDRsFramework.pdf. [Accessed: 08-Feb-2009]
[17] S. Kartha, T. Athanasiou, and P. Baer, “The North-South Divide, Equity and Development – The Need for Trust- Building for Emergency Mobilisation,” in What Next Volume III: Climate, Development and Equity, N. Hällström, Ed. Uppsala: The Dag Hammarskjöld Foundation, 2012, pp. 47–71 [Online]. Available: http://www.dhf.uu.se/publications/development-dialogue/dd61/
[18] UNFCCC, “United Nations Framework Convention on Climate Change.” UNFCCC, 1992 [Online]. Available: http://unfccc.int/resource/docs/convkp/conveng.pdf. [Accessed: 15-Feb-2008]
[19] CAN, “The Core Convention-Based Equity Indicators,” Climate Action Network International, Beirut, 2013 [Online]. Available: http://climatenetwork.org/publication/can-core-convention-based-equity-indicators
[20] E. Kemp-Benedict, P. Baer, T. Athanasiou, and S. Kartha, “Climate Equity Reference Calculator – Glossary,” 2014. [Online]. Available: http://gdrights.org/calculator/glossary.php
[21] E. Kemp-Benedict, T. Athanasiou, P. Baer, and S. Kartha, “Calculations for the Greenhouse Development Rights Calculator,” Stockholm Environmental Institute; EcoEquity, Feb. 2013.
[22] P. Baer, T. Athanasiou, and S. Kartha, “Three Salient Global Mitigation Pathways, Assessed in Light of the IPCC Carbon Budgets,” Jan-2014. [Online]. Available: http://gdrights.org/gdrs-scorecard-calculator-information/mitig-path-overview/. [Accessed: 20-Feb-2014]
[23] N. Höhne, P. van Breevoort, Y. Deng, J. Larkin, and G. Hänsel, “Feasibility of GHG Emissions Phase-Out by Mid-Century,” Prepared by Ecofys for Global Call for Climate Action, Cologne, Project No. CLIDE14075, Oct. 2013 [Online]. Available: http://www.ecofys.com/en/publication/feasibility-of-ghg-emissions-phase-out-by-mid-century. [Accessed: 07-Oct-2014]

Canada as pariah in international climate politics

By , 26 September 2014 20:08

Today I was part of a press conference panel to launch the new edition of the book “The United Nations and Canada”, in which I have a chapter on Canada and UN climate change politics. Even though there was the UNGA’s climate summit this week in New York, report questions were all about ISIS and security and not about climate, so this was a little bit of a waste of my time. Ah well, those are the times.

Anyway, here is my essay “Canada as Pariah in International Climate Politics” in the book “The United Nations and Canada: What Canada Has Done and Should Be Doing at the United Nations”, edited by John E. Trent. (aussi disponible en Français)


Canada as pariah in international climate politics

ABSTRACT
International climate policy-making is scheduled to culminate in a new climate agreement in 2015, which must be extremely ambitious and maximize international cooperation and must therefore be based on equity, trust, accountability and transparency. Despite those being traditional Canadian values, Canada cannot currently effectively advocate for them owing to its standing as a pariah in international climate policy thanks to its history of trust-breaking. To re-build this trust and become once again a genuine international partner, Canada has to bring its domestic climate policy house in order and fully embrace its responsibility and capacity to act ambitiously and urgently within international cooperation processes on climate change.

The current (2014-15) biennium features crucial opportunities to advance international cooperation on addressing the global climate crisis. For September 2014, United Nations Secretary-General Ban Ki-moon invited world leaders to New York for a UN Climate Summit. Governments have also committed to agree on a new, long-lasting climate accord at the 2015 Conference of the UN Framework Convention on Climate Change in Paris.

Climate change is of course a global problem, since the effects of greenhouse gas pollution impact people everywhere, not just in the places where the emissions originate. As such, climate change can only be addressed effectively through international cooperation, which indicates an important role for the UN system. Despite seemingly contradictory rhetoric from the federal government, among others, Canada is a major contributor to global climate pollution, firmly placed in the top 10 of climate polluters regardless whether greenhouse gas emissions are expressed in total per country, per capita or cumulative historic terms.

Therefore Canada must be part of the solution and Canadians clearly understand that: a poll of the University of Montreal and Canada2020 found that the vast majority want the federal government to take the climate challenge more seriously including by joining international treaties. A staggering 76% of Canadians supported Canada joining an international climate agreement even if China and the U.S. are not yet part of it.

However, Canada has a serious image and trust problem in international climate politics stemming from a long history of unfulfilled and abandoned commitments. This includes Canada’s failure to meet the greenhouse gas reduction commitment made in 1997 under the Kyoto Protocol and its subsequent withdrawal from the Protocol (the only country in the world to do so). Furthermore, it is all but certain that the substantially weaker commitment made in 2009 in Copenhagen will also be missed, save for an immediate and thorough change in direction from Canada’s federal government. Additionally, after a short period from 2010 to 2012 of contributing a genuinely fair share ($400 million per year) to a global fund to assist the poorest countries in reducing their own contributions to climate change and dealing with its impacts, Canada’s climate finance contributions have shrunk to very low levels. This is particularly damaging since the 2010-2012 funding was intended to build trust for the next round of climate negotiations with the intention to scale up, rather than stop, this support after 2012. Coupled with the often obstructive strategies and tactics of Canada’s deputations in the day-to-day of UN climate negotiations, these failures cause many governments and civil society organizations to see Canada as a cynical pariah within the UN climate system.

Given this backdrop, the most important contribution that a Canadian government could make to the success of climate policy-making within the UN system is to work in good faith toward restoring this damaged trust.

First and foremost, this requires bringing its house in order domestically through good faith efforts toward meeting the greenhouse gas reduction target promised in Copenhagen. Canada should, for example, provide substantial government support to renewable energy and energy efficiency, and develop and implement policies and measures to drastically reduce emissions from Canada’s leading sources: transportation, oil and gas, and buildings. It would also involve initiating a genuine and honest conversation in Canada about our inevitable transformation away from extracting and burning oil, coal and gas.

In addition to getting domestic climate action on track, Canada must re-build trust on the international stage. An obvious starting point is to restore international climate finance to 2010-2012 levels. But the current international discussions are also about each country’s future emissions reductions target. Canada should propose a deep and ambitious target for itself, one that embraces (not denies) Canada’s role as a major contributor to climate change and that this responsibility, coupled with a wealthy country’s high level of capacity, justifies doing more than others and acting with urgency and vigour.

The new climate accord to be struck in 2015 can only succeed in the long term if it enables and encourages the largest possible degree of international cooperation on climate change, which requires that the accord is based on trust, equity, transparency and accountability. These
characteristics reflect traditional Canadian values and suggest that Canada could play an important role bringing about such an accord. But currently, Canada is not a credible ambassador for such values in international climate politics. By embracing a truly fair share – based on its responsibility and capacity to act – and by showing it is serious to meet that commitment and to help poorer countries to do the most they can (for example, by providing finance, green technology etc), Canada could restore damaged trust internationally and help create the long-lasting, equitable, and ambitious climate accord needed to avoid the worst of climate change.

Further Reading:
IPCC (Intergovernmental Panel on Climate Change): Fifth Assessment Report. http://www.ipcc.ch/report/ar5
World Resource Institute: Climate Analysis Indicator Tool (CAIT) 2.0 Climate Data Explorer. http://cait2.wri.org/
Canadian Coalition for Climate Change and Development (C4D): Protecting Our Common Future: An Assessment of Canada’s Fast-Start Climate Financing. http://c4d.ca/publications/policy- briefs/protecting-our-common-future-report
UN Sustainable Development Solutions Network (SDSN): Deep Decarbonization Pathways. http://deepdecarbonization.org (especially Country Chapter “Canada”)

Le Canada, un paria dans l’univers du changement climatique

By , 26 September 2014 19:20

[Référence: “Les Nations Unies et le Canada: Ce que le Canada a apporté à l’ONU et ce qu’il devrait faire aujourd’hui. Édition 2014”, édité par John E. Trent, Mouvement fédéraliste mondial Canada: Ottawa. En ligne: NationsUniesEtLeCanada.org, p. 20-21]

Christian Holz

SOMMAIRE
L’élaboration d’une politique international sur le changement climatique doit aboutir à un nouvel accord en 2015. Celui-ci doit être extrêmement ambitieux et susciter une vaste coopération internationale, fondée sur l’équité, la confiance, l’imputabilité et la transparence. Bien qu’il s’agisse là de valeurs canadiennes traditionnelles, le Canada n’est pas en mesure de nos jours de les promouvoir de façon efficace en raison de son statut de paria dans le dialogue international sur le climat, notamment à cause de nombreuses ruptures d’engagements. Pour regagner la confiance des pays du monde et redevenir un partenaire international respecté, le Canada doit commencer par mettre de l’ordre dans sa politique nationale sur le climat et assumer pleinement ses responsabilités et mettre sa capacité d’action au service d’une vision ambitieuse et urgente au sein des grandes coopérations internationales sur le changement climatique.

La biennale actuelle (2014-2015) offre des occasions exceptionnelles pour faire avancer la coopération internationale face à la crise du changement climatique. Le Secrétaire général des Nations Unies Ban Ki-moon a invité les leaders du monde à New York en septembre 2014 pour participer à un Sommet de l’ONU sur climat. Les gouvernements sont également convenus de parvenir à un nouvel accord de longue durée sur le climat lors de la conférence de 2015 à Paris sur La Convention-Cadre des Nations Unies sur les Changements Climatiques (CCNUCC).

Le changement climatique est évidemment un problème à l’échelle du monde puisque les effets de la pollution par les gaz à effet de serre affectent les populations partout sur la planète, pas simplement là où les émissions se produisent. Dès lors, le changement climatique ne peut être jugulé de façon efficace que par une coopération internationale, ce qui souligne l’importance du rôle joué par l’ONU. Nonobstant les arguments spécieux du gouvernement fédéral, le Canada, parmi d’autres pays, est un des grands contributeurs à la pollution climatique mondiale. Il appartient aux dix principaux pollueurs climatiques, quelles que soient la façon de classifier les émissions de gaz à effet de serre – total par pays, per capita ou cumulativement.

Dès lors, le Canada doit fait partie de la solution et les Canadiens en sont bien conscients : un sondage établi par l’Université de Montréal et Canada2020 a montré qu’une vaste majorité voulait que le gouvernement fédéral prenne le défi climatique plus sérieusement en considération, notamment en s’associant aux traités internationaux. 76% des Canadiens – un chiffre impressionnant – soutiennent la signature par le Canada d’un accord international sur le climat même si la Chine et les États-Unis n’en faisaient pas encore partie.

Cependant, le Canada souffre d’une perception très négative dans l’univers des discussions sur le climat. L’absence de confiance envers le Canada découle d’une longue histoire d’engagements non tenus ou reniés, à commencer par l’échec du Canada face à ses engagements au titre de la réduction des gaz à effet de serre dans le cadre du Protocole de Kyoto de 1997, suivi de son retrait du Protocole – le seul pays au monde à l’avoir fait. En outre, il est pratiquement hors de tout doute que les engagements subséquents plus faibles adoptés en 2009 à Copenhague ne seront pas respectés à moins d’un changement total d’orientation de la part du gouvernement fédéral canadien. En outre, après une courte période, de 2010 à 2012 pendant laquelle le Canada a apporté une contribution honorable (400 millions de $ par an) à un fonds global pour aider les pays les plus pauvres à réduire leurs propres apports au changement climatique et à faire face à ses impacts, les contributions financières du Canada sont tombées à des niveaux très faibles. C’est particulièrement dommageable étant donné que le financement sur 2010-2013 avait pour objet de créer un climat de confiance dans la perspective de la ronde subséquente de négociations sur le climat, l’objectif étant de susciter une augmentation plutôt que l’interruption de cet appui après 2012. Si l’on ajoute à cela les stratégies et tactiques souvent retardatrices des délégations canadiennes dans le quotidien des négociations sur le climat à l’ONU, ces échecs ont conduit de nombreux gouvernements et organisations de la société civile à considérer les Canada comme un paria cynique au sein du dialogue onusien sur le climat.

Partant de ce constat, la contribution la plus importante que pourrait apporter le gouvernement canadien au succès des élaborations de politique en matière de climat à l’ONU serait de faire preuve de bonne foi en travaillant à restaurer la confiance dans notre pays. Pour commencer, il faut que nous fassions le ménage chez nous en faisant les efforts nécessaires pour atteindre les cibles de réduction des gaz à effet de serre endossées à Copenhague. Par exemple, le Canada devrait fournir un appui public important au secteur des énergies renouvelables et des efficacités énergétiques, élaborer et mettre en œuvre des politiques et mesures visant à réduire de façon massive les émissions provenant des sources principales au Canada: le transport, les hydrocarbures et le bâtiment. Il faudrait aussi amorcer un dialogue honnête et intègre sur la transformation inéluctable à réaliser pour s’écarter éventuellement des industries extractives du pétrole, du charbon et du gaz.

Outre le travail à réaliser à l’intérieur du pays sur le changement climatique, le Canada doit regagner la confiance de ses partenaires internationaux. Le point de départ le plus évident consisterait à rétablir le financement de la lutte contre le changement climatique à ses niveaux de 2010-2012. Mais les discussions internationales actuelles portent également sur les réductions des émissions futures de chaque pays. Le Canada devrait se donner des cibles profondes et ambitieuses, qui acceptent plutôt que de nier le rôle du Canada en tant que grand contributeur au changement climatique. Cette responsabilité, compte tenu du haut niveau de capacité que donne à notre pays notre richesse, justifie de faire plus que les autres et d’agir avec urgence et vigueur.

Le nouvel accord qui doit être réalisé en 2015 ne peut porter fruit à long terme que s’il habilite et encourage le plus haut degré possible de coopération internationale sur le changement climatique, ce qui exige que l’accord soit fondé sur la confiance, l’équité, la transparence et l’imputabilité. Ces caractéristiques reflètent les valeurs canadiennes traditionnelles et donnent à penser que le Canada pourrait jouer un rôle important dans la réalisation d’un tel accord. Mais à l’heure actuelle, le Canada n’est pas un ambassadeur crédible de telles valeurs dans la politique internationale sur la changement climatique. En prenant une part vraiment équilibrée – fondée sur sa responsabilité et sa capacité à agir –et en faisant la preuve qu’il est véritablement décidé à respecter ses engagements et à aider les pays les plus pauvres à faire le plus qu’ils peuvent (par exemple en fournissant des fonds et des technologies vertes), le Canada pourrait rétablir la confiance gravement ébranlée sur la scène internationale et favoriser la conclusion d’un accord durable, équitable et ambitieux, indispensable pour éviter un changement climatique désastreux.

Lectures additionnelles:
Groupe d’experts intergouvernemental sur l’évolution du climat (GIEC)): Cinquième Rapport d’Evaluation (AR5) en anglais : http://www.ipcc.ch/report/ar5
World Resource Institute: Climate Analysis Indicator Tool (CAIT) 2.0 Climate Data Explorer. http://cait2.wri.org/
Canadian Coalition for Climate Change and Development (C4D): Protecting Our Common Future: An Assessment of Canada’s Fast- Start Climate Financing. http://c4d.ca/publications/policy- briefs/protecting-our-common-future-report
UN Sustainable Development Solutions Network (SDSN): Deep Decarbonization Pathways. http://deepdecarbonization.org (surtout le chapitre consacré au Canada)

Unlikely alliance urges Ontario government to adopt price on carbon

By , 6 June 2013 9:56

[originally posted on rabble.ca]

The Ontario premier and members of her cabinet received a letter this week from an unusual alliance of organizations urging her government to swiftly adopt a meaningful price on climate-altering carbon pollution.

The letter shows that there is broad consensus among industry, trade unions and environmental organizations on the need to act now to address climate change by establishing a price on carbon. It is now clear that industry does not agree with oft-repeated claims that reducing carbon pollution will be a demerit to economic activity. In particular, the Cement Association of Canada is one of the signatories of the letter, despite the fact that they would be subject to a carbon price as cement production is a carbon-intensive process. The letter therefore stresses that continued uncertainty and inaction on curbing climate pollution is increasingly costly, threatening Ontario’s leadership role in the economy of the 21st century.

Before being defunded by the Harper government, the National Roundtable on the Environment and the Economy (NRTEE) concluded that a “low-carbon economy is no longer a concept of the future,” and that a “price on carbon is fundamental to achieving the required efficiency gains and innovative drive to support low-carbon growth.” Adopting a price on carbon for Ontario would send a clear signal that Ontario is serious about expanding its green economy and creating the jobs associated with this development. This is one reason why trade unions are in favour of carbon pricing — Blue Green Canada, which unites some of the largest unions and environmental organizations, is another signatory to the letter.

Most importantly, though, a well-designed policy to put a price on carbon is vital for Ontario to meet its greenhouse gas reduction target for the year 2020. Just this week, the Environmental Commissioner of Ontario concluded — in his latest report aptly named “Failing our Future” — that current policies in Ontario will result in a spectacular failure with regards to the 2020 target. A price on carbon could close much of this policy gap and by adopting a “made-in-Ontario” solution to curbing greenhouse gas pollution, Wynne’s government could also avoid subjecting Ontario households and businesses to the expensive and ineffective piecemeal approach being pursued in Ottawa. The good news for Ontarians is that bureaucrats within the government are already consulting on a carbon pricing policy for the province; the bad news is that the current elements of that policy are so weak that they would not achieve anything meaningful for the environment or the development of Ontario’s green economy (our comments to the government on this matter can be found here).

This week’s letter to the Ontario government is clear: support for a meaningful price on carbon is broad, the time to act is now and Ontarians expect their government to live up to its promised pollution cuts and lead the way into the economy of the 21st century.

Creative accounting, not climate progress behind Kent’s ‘progress’ report

By , 9 August 2012 9:52

[originally posted on rabble.ca]

During the press conference that accompanied yesterday’s launch of the 2012 edition of Environment Canada’s “Canada’s Emissions Trends”, Environment Minister Peter Kent claimed the report shows that Canada is now “half way to its target of reducing total greenhouse gas emissions by 17 percent from 2005 levels by 2020.” While Kent went on to claim credit for this purported progress on behalf of the Harper government’s sector-by-sector regulatory approach to greenhouse gas pollution, for most observers it seemed to good too be true, given that the previous year’s installment of the same report indicated that the country had only gone a quarter of its way to that target.

Indeed, a closer read of the report reveals that it is changes in carbon accounting practices rather than actual changes in the federal government’s climate policy that explain most of the difference between this year’s and last year’s numbers. Lower emission numbers on paper are not matched by lower emissions to the atmosphere or any improvements within federal climate policies. In fact, about two thirds of the “progress” claimed by Kent on behalf of his government can be attributed to these changes in accounting. What’s more, more than half of the amount resulting from these dodgy figures would probably trigger an investigation into fraudulent accounting practices, at least in the world of financial accounting.

But don’t take my word for it – let’s have a look at the numbers. At the core of the government’s claim that we are now “half way” to our 2020 target are two projections of emissions for the year 2020. The first estimates how much 2020 emissions would likely be with no policy measures on any level of government taken into consideration (also known as “business-as-usual”, or BAU projection: 850 Mt CO2e[1]). The second projection takes into account the combined effect of all policies and measures that have already been implemented by provincial and federal governments in 2020 – this latter figure was projected to be 785 Mt CO2e in the 2011 installment of “Canada’s Emissions Trends” and is reported as 720 Mt CO2e in this year’s report. Given the government’s Copenhagen target of 17% below 2005 levels, the goal is to emit only 607 Mt CO2e in 2020. When Peter Kent claims to be “half way there”, he is looking at the total distance between the BAU projections for 2020 of 850 Mt and this goal of 607 Mt. In the graphic below, taken from “Emissions Trends”, Kent’s claim corresponds to the “Reductions to Date” section on the right of the graph.

The specific section that we need to look at is the difference in 2020 between the “2011 Trend Line” and the “2012 Trend Line” – about 65 Mt CO2e. It is these 65 Mt that Minister Kent refers to when he says: “Last year, we were one-quarter of the way to our goal. And now we’re half way there. This shows the significant progress we are making.” As I said before, at least two thirds of these 65 Mt CO2e can be attributed to changes in accounting – partly deliberate deception of the Canadian public, partly outright fraudulent accounting scam.

 Scenarios of Canadian Emissions to 2020

Source: “Canada’s Emissions Trends 2012”, Environment Canada, 2012

First, the deliberate deception of the public: The 2011 edition of “Emissions Trends” used an estimate of 710 Mt CO2e when reporting Canada’s emissions for 2010. The report used an estimate because actual data did not yet exist. This data has since become available and turned out to be lower than expected: emissions were 692 Mt CO2e, or 18 Mt lower than estimated. In this year’s report, Environment Canada uses this figure in place of the estimate. This is seen quite clearly in the graph above: the two “Trend Lines” start at the same point in 2009 and the next data point is 2010, with a noticeable distance between them. This distance is the 18Mt difference between the old estimate and the actual data. As a result, even if nothing else would have changed in the modeling of the 2020 projections between last year’s and this year’s “Emissions Trends”, the 2020 projections would be lower by at least these 18 Mt CO2e (thus accounting for 28% of the claimed “progress” of 65 Mt CO2e compared with last year’s projections).

Of course, Environment Canada was absolutely doing the right thing when they replaced the wrong numbers with updated ones (and the report actually states upfront, on p .2, that this correction is one of the 4 major reasons for the difference of the 2020 projection). However, the Harper government spins this simple correction of previous accounting inaccuracies into a claim of a “significant progress we are making”. This is disingenuous at best and – when seen in the context of the other number games in this report – more likely a deliberate attempt to mislead the Canadian public on the government’s performance.

Now lets turn to the more sinister issue. Looking at the report, we find for the first time an item “Expected LULUCF Contributions” (LULUCF is UN speak for “Land Use, Land Use Change and Forestry” but for our purposes we can just read it as the “Forestry sector”). These “contributions” are valued at 25 Mt CO2e in 2020 – a significant amount given that the total emission reductions that Steven Harper promised in Copenhagen are a mere 125 Mt CO2e below 2005 levels. These 25 Mt CO2e also account for about 38% of the difference between the projected 2020 emissions in the 2011 and 2012 “Emissions Trends” respectively, in other words they account for 38% of the “progress” that Peter Kent is claiming the Harper government is responsible for.

To understand why this 25 Mt CO2e number can be considered the result of fraudulent accounting we need to leave Canada for a moment and go back to Durban in December 2011 – just over half a year ago. In that place and time, the most recent round of negotiations under the UN Climate Change Convention was taking place. Within the negotiation stream dealing with the rules of the Kyoto Protocol (the accord that Harper would famously abandon the instance the conference was over), Canada’s delegates were hard at work trying to convince the rest of the world of a new approach to account for the CO2 emissions that result from trees being cut down through logging (“Forest Management” or “harvesting” in UN speak). Under this new approach, which ended up being adopted at the conference, countries would agree to country-specific “reference levels” of logging activities for the period 2013-2020. Actual logging during this period would then be compared to these reference levels. In other words, if a country would end up doing more logging than it had said it would, it would have to account for the extra emissions, while on the other hand a country whose logging activities remained below the agreed “reference level” would get credits for the difference in its carbon accounts. Crucially for understanding the scam in the new emissions figures, the Harper government told the world’s countries in Durban that it expected its logging activities in the period 2013 to 2020 to be constant and equal to the average of the historical logging levels between 1990 and 2009. As a result, Canada’s “reference level” for logging was set at that level[2].

Returning to 2012, we find a completely different world – at least on paper: the federal government is now telling us that its “current projections suggest that harvests will remain below the recent average historical level used in estimating the reference level” (page 38). This change, from expecting the 2013-2020 logging to be the same as the 1990-2009 average to suddenly expecting it to be substantially lower is what is behind the 25 Mt CO2e “contribution” of the LULUCF sector. It is important to emphasize that there is no government plan or policy to reduce or limit logging in Canada’s forests nor has there been any meaningful change in the state of the Canadian forestry industry over the half year that separate these two directly opposing expectations of the level of logging activities in 2020.

This is why I believe it is appropriate to speak of fraudulent accounting practices for this segment of Kent’s purported “progress”: the government deliberately used one set of assumptions to set the “reference level” and then arbitrarily switched to another set of assumptions in order to create an impression of “progress” out of thin air. Meanwhile, nothing in the real world has changed.  There has been no change in policy and no change in the amount of greenhouse gas pollution in the atmosphere. This is fraudulent accounting because the only possible explanation for this is an attempt to deliberately mislead the Canadian public in the hope that carbon accounting is too complex for most of us to understand. Kent hopes that we won’t see through this scam and we will swallow his government’s spin of alleged progress on climate change.

In the world of finance, if similarly fraudulent accounting tricks would be used to deliberately mislead the public – for example, to keep a company afloat or stock prices high – criminal investigations would, and often do, ensue. Accounting scams that risk a safe climate for future generations are clearly even more objectionable and immoral. Amidst a summer that is poised to become the hottest summer on record in Canada, with climate change impacts being felt across the country, the need for ambitious action to address global warming has never been clearer. Kent’s “creative” accounting will get us nowhere.


Dr. Christian Holz is the Executive Director of Climate Action Network Canada – Réseau action climat Canada (CAN-Rac), a network of over 85 environmental, faith, development, labour, aboriginal, health, and youth organizations committed to making action on climate change by Canada a reality. Prior to joining CAN-Rac he completed his PhD research at the University of Glasgow wherein he closely followed UN climate negotiations and the role of environmental organizations in those negotiations.

Notes:

[1]      Global warming pollution is measured in units of “Mt CO2e” (megatons of carbon dioxide equivalents), with each of these units consisting of one million metric tons of carbon dioxide, or an amount of another greenhouse gas that is equivalent to one million metric tons of carbon dioxide.

[2]      The government’s submission to the UN climate convention in preparation for the Durban meeting explains this in detail. Here is the crucial sentence: “Harvest rates are projected to remain at that level [the average level observed for 1990 to 2009] from 2013 to 2020” (page 8, paragraph 30). “Emissions Trends 2012” is also restating that this assumption was, indeed, the basis for Canada’s reference levels: “Canada’s reference level […] was derived by assuming that future harvests in 2013 to 2020 would be the same as the average historical level between 1990 and 2009” (page 37-38).

Panorama Theme by Themocracy